Focusing Down: Implementing Laravel Livewire Infinitely Reduced Page Load
Updated on July 07, 2020
Tweet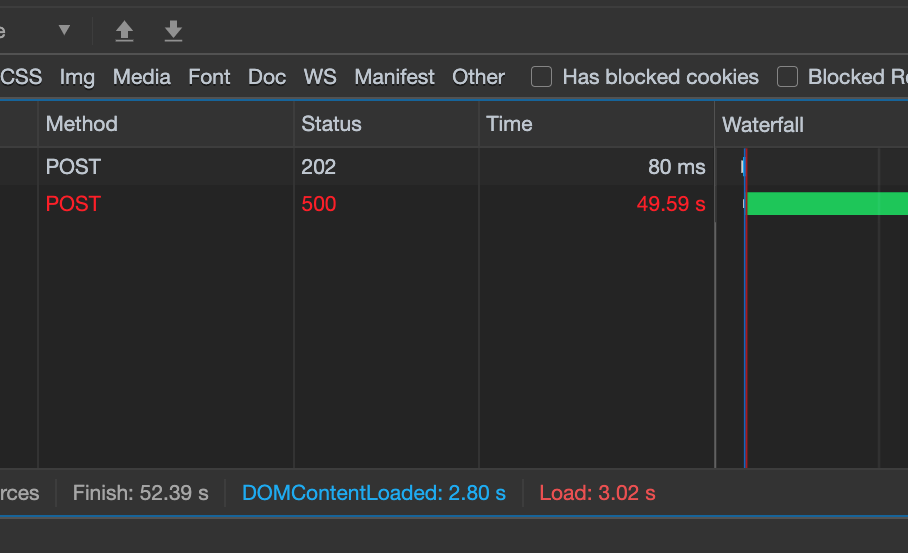
For several years now, there has been a trend that looks good at first, but over time tends to really gum up applications and annoy developers... Dashboards. I'm not talking about simple dashboards that focus on one area of the business, like call center metrics or sales trends. I'm talking about the "I want to see everything at all times so let me see how many boxes I can fit on a single page" dashboards. The "I want a birds-eye view of my entire business and please make it work on mobile so I can check on every operation at all times" dashboard.
Almost every single theme on themeforest has several iterations of how you can layout all this data on a single page. I will admit, these dashboards are visually appealing and can really give that wow factor when first delivering the ultimate dashboard. I was once guilty of this myself. I would spend hours figuring out how to put together the world's craziest jigsaw puzzle so that it was digestible and actually useful. Implementing seldom-used drill-down links, aggregating non-actionable metrics, and my personal favorite, the all-knowing calendar picker to see snap-shot data across the entire organization.
When Data No Good
Data is not a bad thing. The more visibility provided to a company's executives, the better decisions they will be able to make (presumably). The problem with the above described dashboards is that typically the department heads would each focus on just one area of the dashboard. Rarely was any one ever interested in everything all the time. Asking the right questions at the on-set of a project is essential to avoid future problems. Find out who needs what and develop focused dashboards for each department's needs.
Not too long ago, I inherited a client's dashboard that needed some serious work. Visually it looked fine, just like all the other dashboards. The reason it was thrown over to me for some TLC was that it was an essential dashboard and the team was experiencing constant 500 errors. The breakdown in performance was having a dramatic affect on the teams output and the company's ability to uphold its SLA.

Photo by Aron Visuals on Unsplash
Is a 45 Second Page Load Bad?
When the dashboard first loaded, it would fire an ajax request to pull all the data necessary to fill in the tables and charts. The 470 or so lines in the controller method, executed multiple sequel queries loaded with joins and n+1 problems. Even nested n+1 loops for added flavor. This resulted in 45+ second page loads until the server finally ran out of memory and returned a 500 error. And who could blame the poor server!
Now, of course, it didn't start its life this way. It mutated based on the company's needs over time and as they brought on more clients. A fairly common story, especially in examples of great success where it's difficult to keep up with rapid growth.
Taking Out The Chopping Block
The first thing on my list was to identify who needed what. Through my own investigation and interrogation, I concluded the unique departments utilizing the dashboard only used a specific part of the dashboard and had no use for the rest of the page. I was now able to take this dashboard and break it up into three separate pages that performed better and provided a better experience for the respective teams.
The main dashboard functionality was business-critical and it would be the one to get the Laravel Livewire treatment along with a dash of AlpineJS. TALLing this baby up was going to be awesome!
Match Made In Heaven
The main dashboard was essentially an active user's list. Different business decisions were made depending where the user was in their process. So a 45+ second page load time that culminated in a 500 error was obviously no bueno. Since the internal teams needed the dashboard data to be fresh, I was originally going to leverage the built-in wire:poll Livewire directive but instead I went with a different approach. I wanted to give the user the ability to choose how often the dashboard refreshes.
I setup a refresh button the user could use to manually refresh the dashboard and leveraged this same button for my refresh timer. On the refresh button I used wire:click="$refresh", which is an easy way to re-render the Livewire component without firing any actions. I then pulled in AlpineJS to manage the refreshing behavior. The ability to quickly implement a feature like this is one of the many reasons I fell in love with AlpineJS. It helps simplify the front-end development experience and helps clear mental road blocks when trying to make a user interface as usable as possible.
All AlpineJS is doing is "clicking" the refresh button based on the interval selected by the user from the dropdown. For the user, this functionality just makes sense, but for a developer, it can sometimes become difficult to implement something like this into a UI. With Livewire and AlpineJS, I have experienced a lot less frustrations when architecting a critical page.
Photo by Sebastiano Piazzi on Unsplash
Where We're Going We Don't Need Roads
I was able to take a dashboard that loaded for over 45 seconds only to then error out and delivered a page that consistently loaded in less than 200 milliseconds. Not too shabby if I do say so myself! This revamped experience unlocked several possibilities and the team came back with more requests. No problem! Now that we had a beautiful foundation laid out for the dashboard, we are able to iterate quickly and deliver much needed features to out internal teams.
God Bless Caleb Porzio for daring to dream!